


So in the first portion of the blog we covered the key terms related to Spark and tried to understand the how Apache spark works in general. This blog is the continuation of previous one. Here we will cover the installation of PySpark and also we will create a regression model using PySpark's ML module. If you have not read the first portion of this blog please go through it once.
Installing Spark
Truth speaking installing Spark is a pain in the butt, at least for me and we are not going to install anything locally. Spark applications could be written in multiple languages and each of installations is different. The Spark API is written in Scala but the wrapper PySpark API is in Python. Here we will use Google Colab to install PySpark instead of configuring it locally.
Once you’ve got a Colab notebook up, to get Spark running you have to run the following block of code
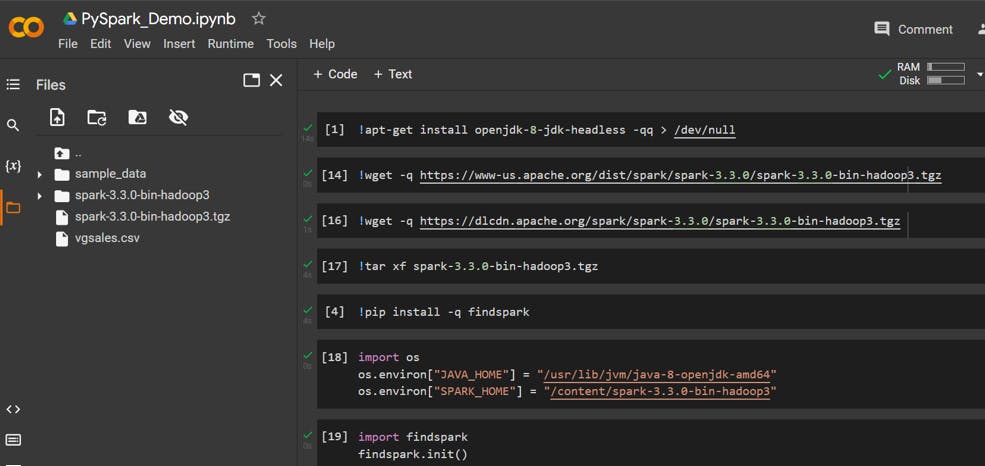
Note: Make sure to use latest available Spark and Hadoop version you are choosing. Here we are using Spark 3.3.0 with Hadoop3 and the working download website is dlcdn not the www-us.apache.org.
Basically this block of code downloaded the right versions of Java (Spark uses some Java) and Spark, set the PATH to those versions, and to initialize Spark in your notebook.
In order to install and run Spark on different platform you can refer below links.
Some Spark Coding
We will be using Spark SQL for DataFrames.
NOTE: To avoid confusion although we are using Spark SQL but non of these code going to be SQL but you can write SQL queries when working with Spark DataFrames but you don’t have to.
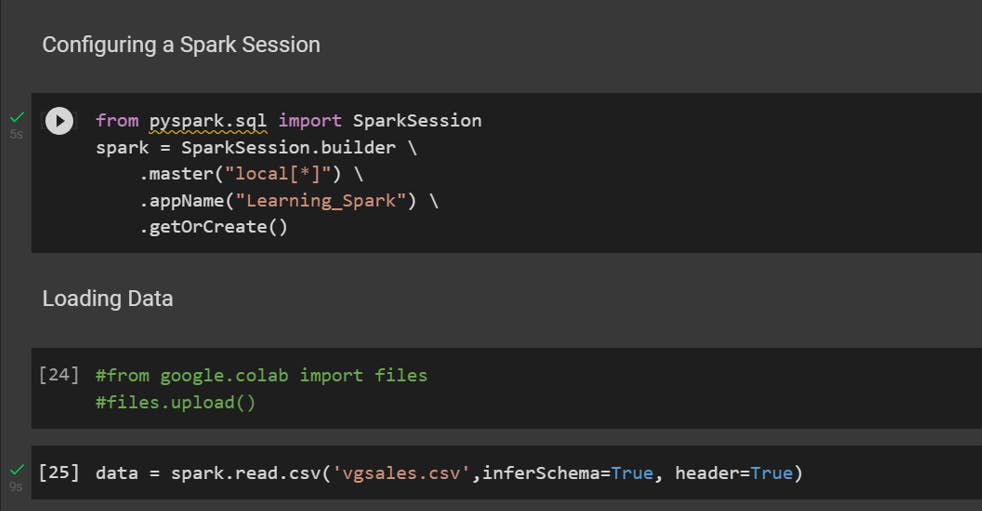
The entry point to using Spark SQL is an object called SparkSession. It initiates a Spark Application which all the code for that Session will run on.
The Fig-1 shows how to create a SaprkSession and load the data to a DataFrame. Here we are using Video Game Sales dataset from Kaggle.
Data Explorations
Now let’s move into understanding how we can get more familiar with our data!
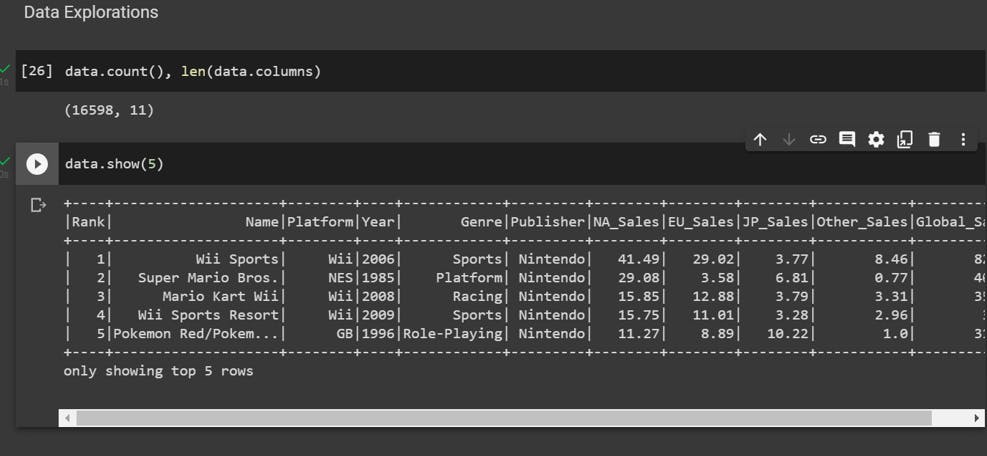
The first thing we can do is check the shape of our DataFrame. Unlike Pandas, there is no dedicated method for this but we can use .count() and .columns() to retrieve the information ourselves.
The .count() method returns the number of rows in the DataFrame and .columns returns a list of column names.
The Fig-2 shows the codes for the same.
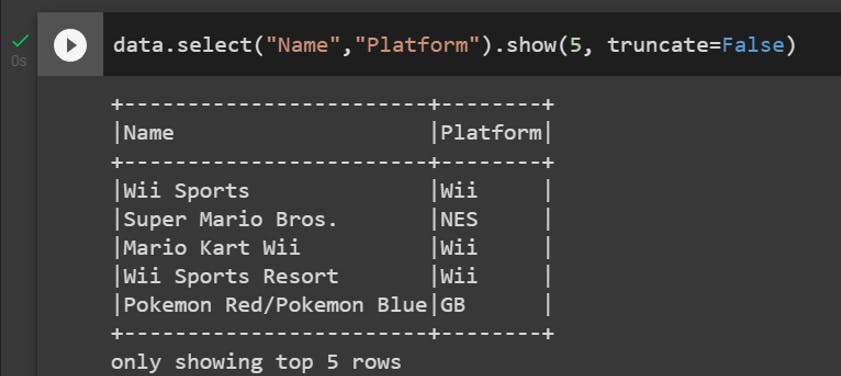
We can select specific columns of the dataset.
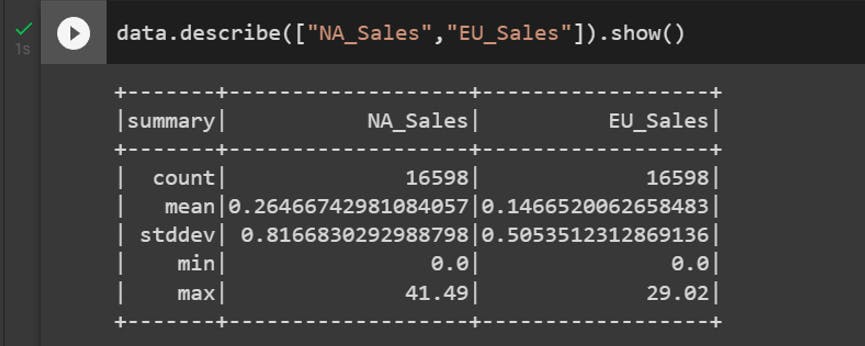
By using describe() function we can get Summary and Statistics information about the numerical columns. The PySpark commands are similar to Pandas. Those who are familiar with Pandas I believe will be able to grab the PySpark syntax quickly.
Building Models with PySpark
Building models in PySpark looks a little different than you might be used to, and you’ll see terms like Transformer, Estimator, and Param.
To know more about the Spark ML library: ml-pipeline
For an example of linear regression, let’s see if we can predict User_Score from Year_of_Release, Global_Sales, Critic_Score, and User_Count.
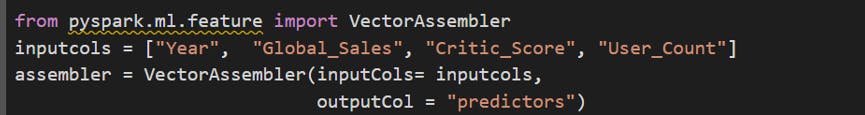
Now we will use VectorAssembler which will delineate what features we want our model to use as predictors so that it can take those columns and transform them into a single column (named “predictors”) that contains all the data we want to predict with.
What VectorAssembler.transform() does is create a new DataFrame with a new column at the end where each row contains a list of all the features we included in the inputCols parameter when we created the assembler.

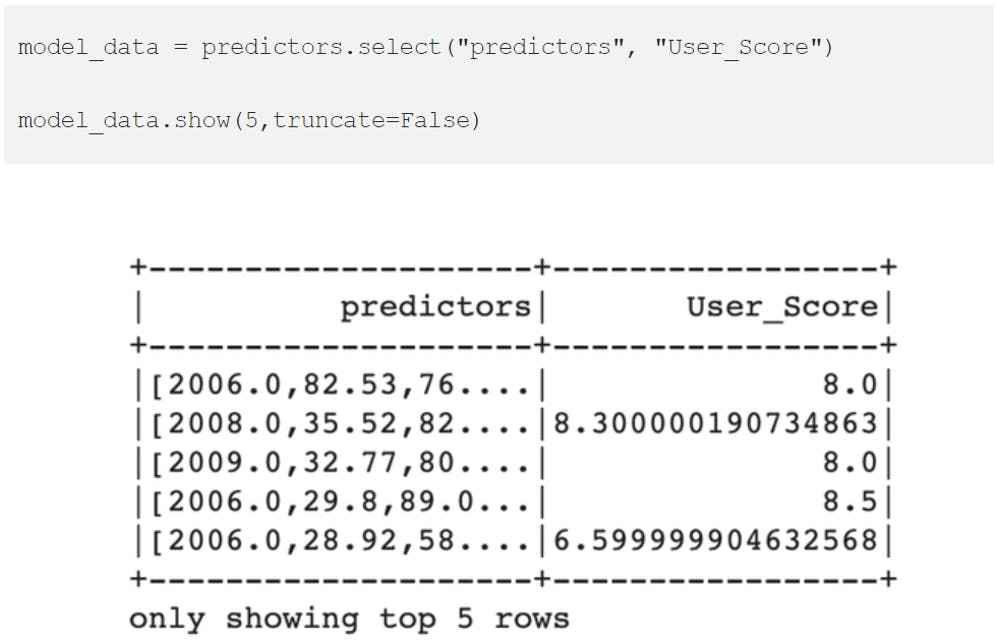
The final step to getting our data ready to be used in a model is to collect the new predictions column we just made and User_Score (our target variable) by themselves in a DataFrame.
Note: Because the Colab notebook session expired and failed to reconfigure the Spark and uploading the dataset, I need to redo the setup on a different machine hence the code output visuals looking different.
Model Training
Lets split the dataset and train the model

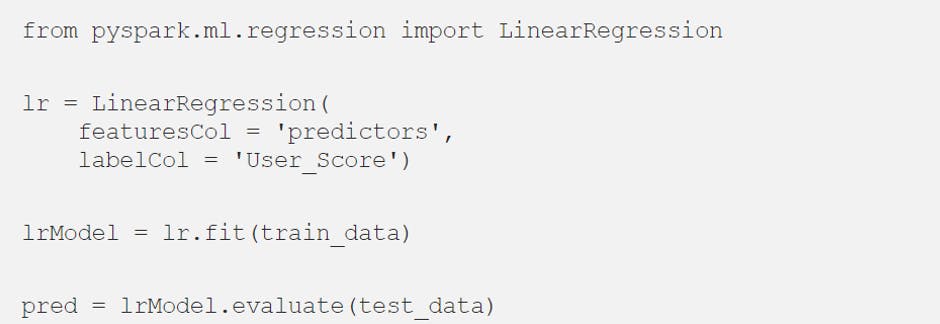
We will train a LinearRegression model with above data.
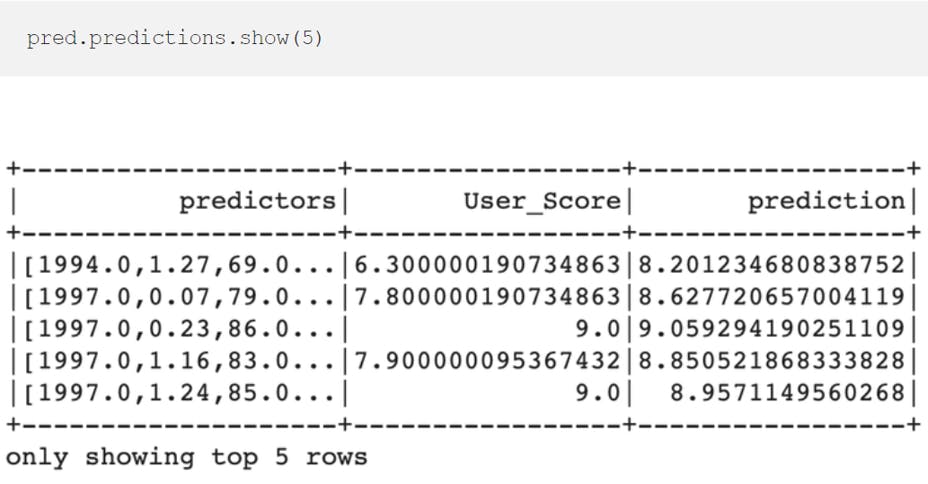
Viewing the top predictions
Model Evaluation
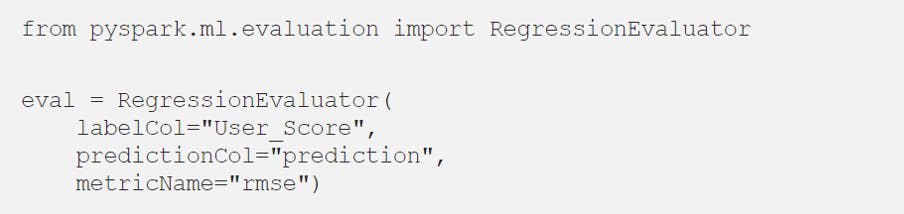
To get more detailed information on how our model performed, we can use RegressionEvaluator as below
Computing some more regression errors
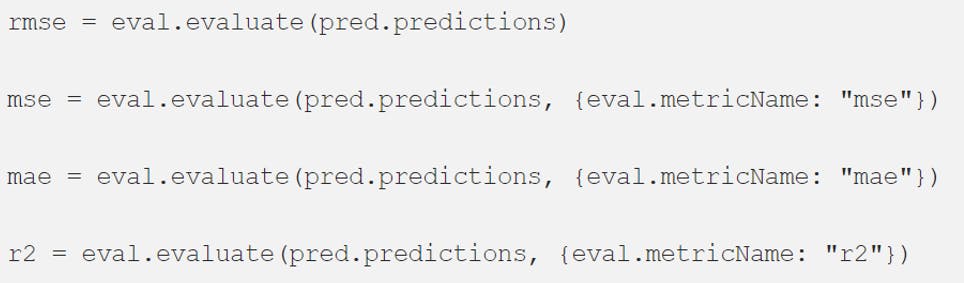
and values
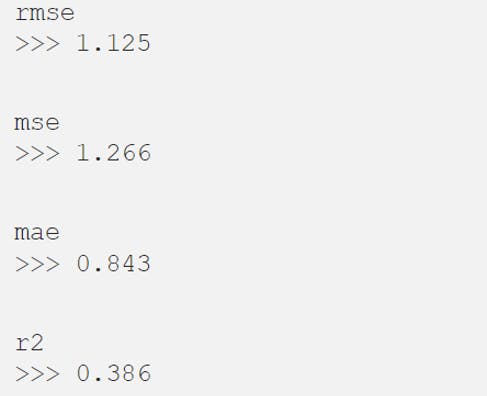
Considering the rmse error we can interpret that our model tended to be about 1.125 rating points off from the actual User_Score.
Conclusion
Wow! We have learned a lot of critical terms and tried to implement a regression model using PySpark which used Spark in backend for distributed data processing. Even though we just scratch the surface of Spark world my hope is that this guide can be a resource for you as you continue working with Spark. Hope you have liked the post. Happy learning !!